Lesson 31. International Banking
← К разделуLesson 31. Task 5. B. Describe the graphs following the suggested blueprint
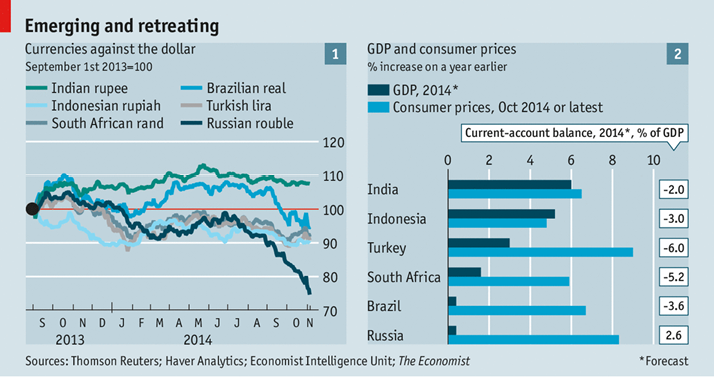
1. What type of graph is it?
2. Which data are represented by the chart?
3. What period does the study cover?
4. Which institutional body has granted the data?
5. Which states are included into the analysis?
6. What trends does the graph indicate?
7. What is the character of changes represented?